
Whether this is your first 10K or your hundredth, it’s helpful to have a 10K pace chart to guide your training and race day pacing. Instead of trying to guess what pace you should be running in workouts or race day, use this as your built-in cheat sheet.
In the 10k pace chart below, you can either look for your goal finish time or find the associated per-mile/per-kilometer pace. This way, you can plan your own specific pace target and race splits.
Or, if you’re new to running, you may simply look at your current mile time to see how long it will take to run a 10K.
What is a Good 10K Time?
The age-old question of what’s a good pace. As always, the answer is that it depends on many factors, including your age, fitness level, experience, training, health, race course, and even the weather.
The 10K is an interesting distance because at the elite level it’s most often run on a track! And while it’s an endurance event, it’s still considered part of the standard track and field lineup, unlike the half-marathon and marathon, which are done as road races.
The 10K world record holders currently are:
- 26:11 (4:13 mile) by Joshua Cheptegei of Uganda at Valencia in October 2020
- 28:46 (4:38 mile) Agnes Ngetich of Kenya at Valencia in January 2024
Meanwhile, the average runner is going to be closer to an 8:00 to 12:00 per mile pace, which equals a 45-minute to 75-minute 10K finishing time.
According to data from 2019 RunRepeat, the average male road racer finishes in about 56 minutes (9:02/mile pace). For that to be the average, there are a lot of folks finishing both slower and faster than that!
What is the Average Pace for a 10K For Women?
The average 10k pace for women is about 1 hour and 3 minutes (10:15/mile pace) or roughly 6:23 per kilometer pace.
You could break down a good time by age, gender, experience and so much more. It’s important not to worry about what “good” is for anyone else, but to focus on running your best race!
- Age 16 to 19 the average is 01:00:21
- Age 20 to 24 the average is 00:59:50
- Age 25 to 29 the average is 01:02:25
- Age 30 to 34 the average is 01:02:31
- Age 35 to 39 the average is 01:02:19
- Age 40 to 44 the average is 01:02:37
- Age 45 to 49 the average is 01:03:27
- Age 50 to 54 the average is 01:04:04
- Age 55 to 59 the average is 01:07:41
Men’s average pace times tend to be about 7-8 minutes faster in all age groups.
10K Pace Chart
You can check out this pace calculator for more detailed numbers, but this pace table will help you find your average pace for your goal time.
The running pace chart lists your average pace per mile or per KM to provide a corresponding finishing time.
The great thing about this is that for most runners, a steady, even pace from start to finish is the best way to achieve a personal best or finish the race feeling strong.
That’s right, going for a negative split isn’t ideal, since we assume we’ll have more energy in the second half, which isn’t usually the case.
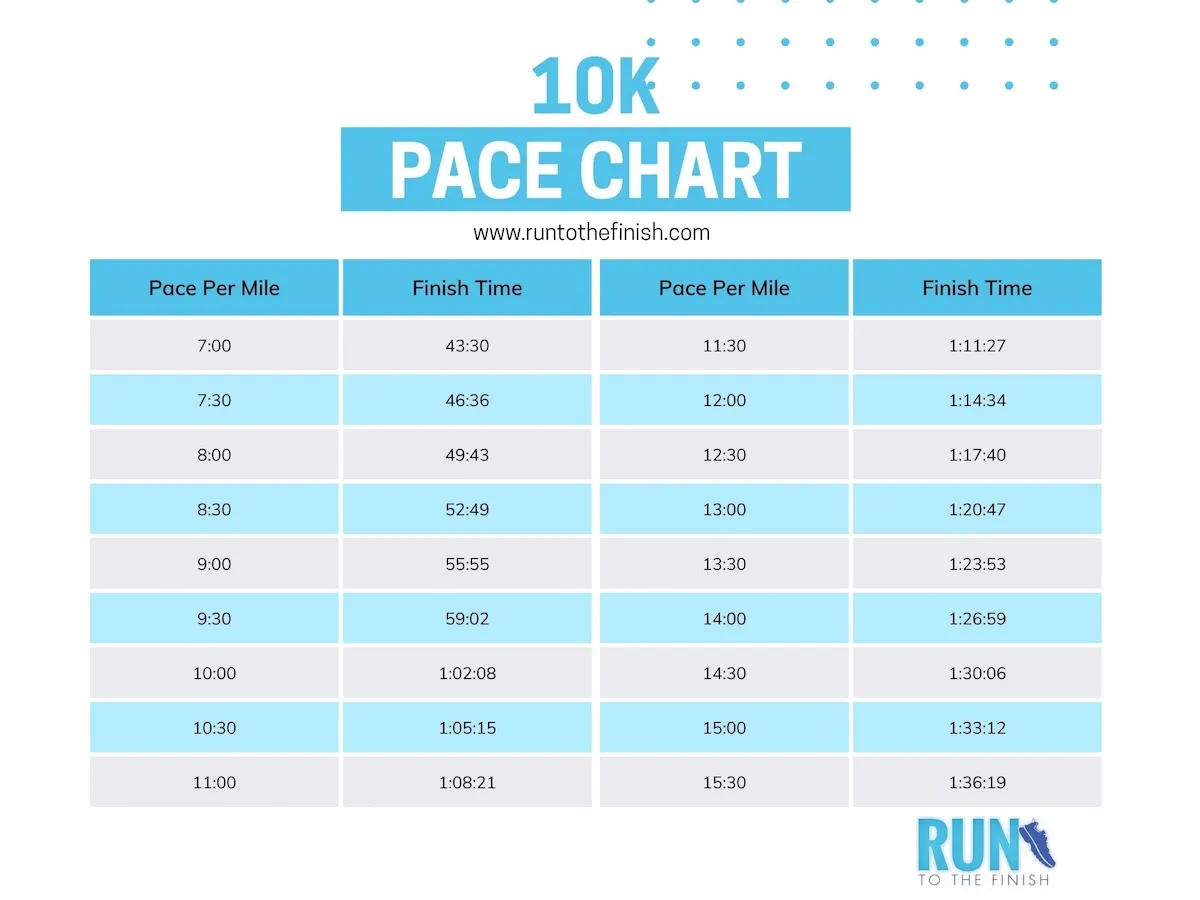
The following paces are provided in average mile/km time. Find your goal finishing time to see the goal pace.
Or start with your current easy run pace to see where you might finish.
Look at the chart and find the finishing time of the races according to your pace, which is broken out in 30-second increments.
Remember, this doesn’t account for any specific type of course (hilly, lots of turns, hot weather). It’s simply providing a per-mile time to hit that finish line.
Pace chart in miles
Pace | Mile 1 | Mile 2 | Mile 3 | Mile 4 | Mile 5 | Mile 6 | Finish |
5:00 | 5:00 | 10:00 | 15:00 | 20:00 | 25:00 | 30:00 | 31:04 |
5:30 | 5:30 | 11:00 | 16:30 | 22:00 | 27:30 | 33:00 | 34:10 |
6:00 | 6:00 | 12:00 | 18:00 | 24:00 | 30:00 | 36:00 | 37:17 |
6:30 | 6:30 | 13:00 | 19:30 | 26:00 | 32:30 | 39:00 | 40:23 |
7:00 | 7:00 | 14:00 | 21:00 | 28:00 | 35:00 | 42:00 | 43:30 |
7:30 | 7:30 | 15:00 | 22:30 | 30:00 | 37:30 | 45:00 | 46:36 |
8:00 | 8:00 | 16:00 | 24:00 | 32:00 | 40:00 | 48:00 | 49:43 |
8:30 | 8:30 | 17:00 | 25:30 | 34:00 | 42:30 | 51:00 | 52:49 |
9:00 | 9:00 | 18:00 | 17:00 | 36:00 | 45:00 | 54:00 | 55:55 |
9:30 | 9:30 | 19:00 | 28:30 | 38:00 | 47:30 | 57:00 | 59:02 |
10:00 | 10:00 | 20:00 | 30:00 | 40:00 | 50:00 | 1:00:00 | 1:02:08 |
10:30 | 10:30 | 21:00 | 31:30 | 42:00 | 52:30 | 1:03:00 | 1:05:15 |
11:00 | 11:00 | 22:00 | 33:00 | 44:00 | 55:00 | 1:06:00 | 1:08:21 |
11:30 | 11:30 | 23:00 | 34:30 | 46:00 | 57:30 | 1:09:00 | 1:11:27 |
12:00 | 12:00 | 24:00 | 36:00 | 48:00 | 1:00:00 | 1:12:00 | 1:14:34 |
12:30 | 12:30 | 25:00 | 37:30 | 50:00 | 1:02:30 | 1:15:00 | 1:17:40 |
13:00 | 13:00 | 26:00 | 39:00 | 52:00 | 1:05:00 | 1:18:00 | 1:20:47 |
13:30 | 13:30 | 27:00 | 40:30 | 54:00 | 1:07:30 | 1:21:00 | 1:23:53 |
14:00 | 14:00 | 28:00 | 42:00 | 56:00 | 1:10:00 | 1:24:00 | 1:26:59 |
14:30 | 14:30 | 29:00 | 43:40 | 58:00 | 1:12:30 | 1:27:00 | 1:30:06 |
15:00 | 15:00 | 30:00 | 45:00 | 1:00:00 | 1:15:00 | 1:30:00 | 1:33:12 |
15:30 | 15:30 | 31:00 | 46:30 | 1:02:00 | 1:17:30 | 1:33:00 | 1:36:19 |
16:00 | 16:00 | 32:00 | 48:00 | 1:04:00 | 1:20:00 | 1:36:00 | 1:39:25 |
Pace chart in kilometers
Pace | 2 km | 4 km | 6 km | 8 km | Finish |
3:06 | 6:13 | 12:26 | 18:38 | 24:51 | 31:04 |
3:25 | 6:50 | 13:40 | 20:30 | 27:20 | 34:10 |
3:44 | 7:27 | 14:55 | 22:22 | 29:50 | 37:17 |
4:02 | 8:05 | 16:09 | 24:24 | 32:18 | 40:23 |
4:21 | 8:42 | 17:24 | 26:06 | 34:48 | 43:30 |
4:40 | 9:19 | 18:38 | 27:58 | 37:17 | 46:36 |
4:58 | 9:57 | 19:53 | 29:50 | 39:46 | 49:43 |
5:17 | 10:34 | 21:08 | 31:41 | 42:15 | 52:49 |
5:36 | 11:11 | 22:22 | 33:33 | 44:44 | 55:55 |
5:54 | 11:48 | 23:37 | 35:25 | 47:14 | 59:02 |
6:13 | 12:26 | 24:51 | 37:17 | 49:42 | 1:02:08 |
6:32 | 13:03 | 26:06 | 39:09 | 52:12 | 1:05:15 |
6:50 | 13:40 | 27:20 | 41:01 | 54:41 | 1:08:21 |
7:09 | 14:17 | 28:35 | 42:52 | 57:10 | 1:11:27 |
7:27 | 14:55 | 29:50 | 44:44 | 59:39 | 1:14:34 |
7:46 | 15:32 | 31:04 | 46:36 | 1:02:08 | 1:17:40 |
8:05 | 16:09 | 32:19 | 48:28 | 1:04:38 | 1:20:47 |
8:23 | 16:47 | 33:33 | 50:20 | 1:07:06 | 1:23:53 |
8:42 | 17:24 | 34:48 | 52:11 | 1:09:35 | 1:26:59 |
9:01 | 18:01 | 36:02 | 54:04 | 1:12:05 | 1:30:06 |
9:19 | 19:38 | 37:17 | 55:55 | 1:14:34 | 1:33:12 |
9:38 | 19:16 | 38:32 | 57:47 | 1:17:03 | 1:36:19 |
9:56 | 19:52 | 39:44 | 59:35 | 1:19:27 | 1:39:25 |
All right, now that you’ve got this useful tool for figuring out your goal pace. It’s time to fine-tune your training to get those race results. That means appropriate training with interval sessions, strength training, core workouts, good fueling, and enough easy miles.
If you’re looking for pace charts of other common race distances, check out my marathon pace chart and half marathon pace chart.
For indoor running, I highly recommend this treadmill pace chart, which will also teach you how to use it specifically for the treadmill.
How to Pick a Goal Finish Time with a Pace Chart?
If you’re having trouble setting a goal for your upcoming race, the 10k pace charts above should help.
If you’ve raced before, you can use that time as a base during training and start working on speed workouts at your new goal pace. Newer runners can often make big jumps like a 1 min per mile faster, while more experienced runners may really be pushing to shave off 5 seconds per mile to hit a PR.
The goal during training is to slowly build up the time you can spend at your goal pace during your hard workouts. This will help you determine whether it’s a realistic 10KM race pace.
We hope that this 10k pace chart was helpful. If you have more questions, drop them below!
Looking for more training tips?
- Printable 10K Training Plans
- Training Paces Calculator
- 10K Training Guide
- 10K Race Day Tips – Pacing and Strategy
- Treadmill Pace Chart – MPH to mile pace
Other ways to connect with Amanda
Instagram Daily Fun: RunToTheFinish
Facebook Community Chatter: RunToTheFinish
Sign Up to Receive a Weekly Newsletter with Top Running Tips and Laughs


 Notace Yama T1 Review | Minimal Trail Shoe with Maximum Ground Feel and Traction

How about providing a chart with pace per km, instead of per mile?
I’m super confused there is an entire KM chart, it’s just not a graphic. But it covers all paces